

Red vs. Blue: Who's seeing the biggest ACA coverage losses?
Tue, 01/13/2026 - 5:56pm
Back in September I ran an analysis of the ~24 million Americans enrolled in ACA exchange healthcare coverage to try and get a better idea of the partisan impact of the expiration of the enhanced tax credits.
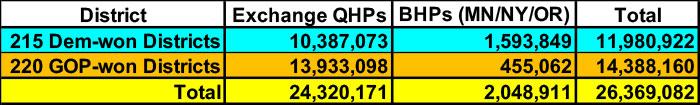
While it was already common knowledge that red states have significantly more ACA enrollees than blue ones (mainly because 9 of the 10 states still refusing to expand Medicaid under the ACA are red ones), I wanted to take a more granular look, so I broke enrollment out at the Congressional District level instead, and determined that while there are definitely more people in red districts who were about to be hit with massive net premium hikes, it wasn't a massive gap...it was around 20% higher in districts won by Republicans than by Democrats, which is significant but not jaw-dropping.
In any event, now that the 2026 ACA Open Enrollment Period is nearly finished and the Centers for Medicare & Medicaid Services (CMS) has published a semi-final breakout of actual exchange enrollment by state, I decided to break those numbers out in several different ways. Unfortunately, it will be awhile before I'm able to do so by Congressional District, but I can at least do so at the state level.
First of all, here's the main table; this is identical to the one I posted yesterday with two additions:
- I've added a column listing whether the state has expanded Medicaid or not;
- I've added another section at the bottom adding in Basic Health Plan (BHP) enrollment in the 3 states which have that program in place (the District of Columbia just launched theirs this fall & doesn't have any data available yet; it's likely only around 25,000 or so at most)
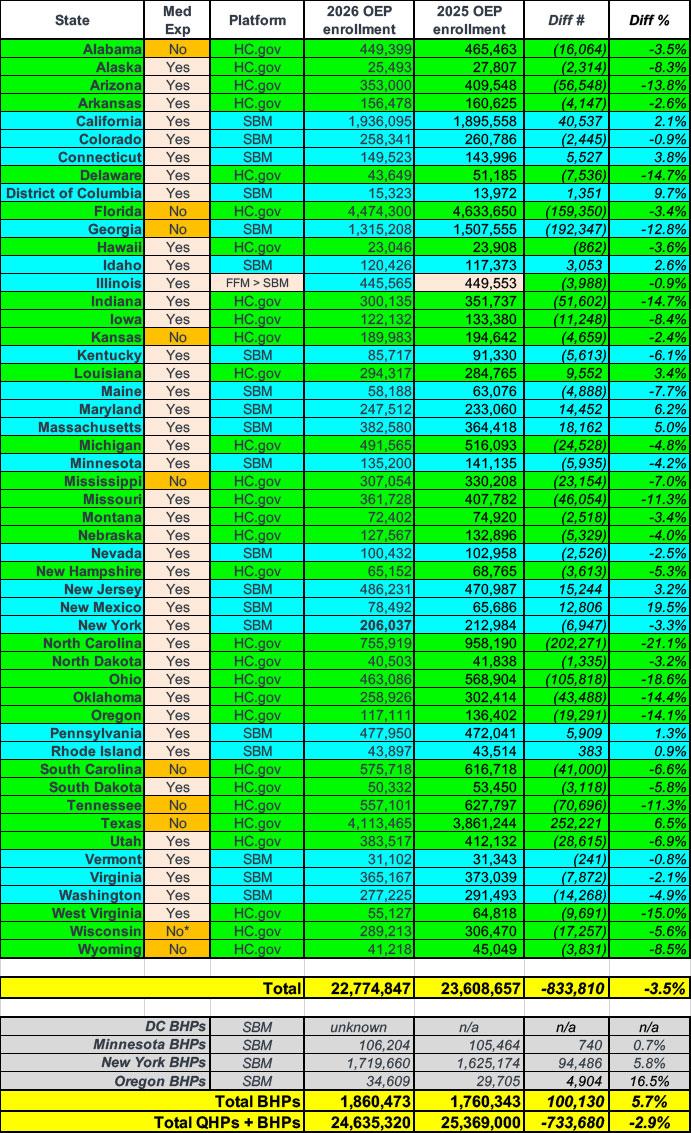
As I noted yesterday, the most obvious things which jump out are:
- New Mexico enrollment is up nearly 20% thanks to the state backfilling 100% of the lost federal tax credits
- North Carolina enrollment is down over 20% (biggest drop in the country)
- Ten other states have seen enrollment drop by double digits as well
- While New York's BHP enrollment is up nearly 6% vs. a year ago, that's going to drop dramatically this summer when eligibility for their Essential Plan program drops from 250% of the Federal Poverty Level down to 200% FPL.
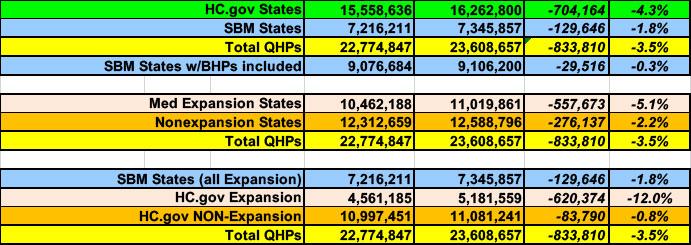
Next, here's how the numbers look when broken out a couple of different ways:
- Federal marketplace vs. state-based marketplace (which includes Illinois this year; I shifted their 2025 enrollment data over from HC.gov accordingly). The enrollment drop is more than twice as high for HC.gov states vs. SBM states...and over 14x higher (down 4.3% vs. 0.3%) when you take the BHP enrollees into account.
- Medicaid expansion vs. non-expansion states: Again, the expansion states as a whole have seen enrollments drop by more than twice as much as non-expansion states. This is even more dramatic when you combine the type of exchange with the states Medicaid expansion status, although the significance of this is a bit difficult to parse out.
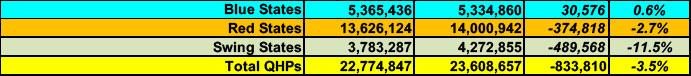
Finally, we get to the heart of the matter: Red, Blue and Swing states.
Some of this is a bit objective, of course, but I went with the following:
- Red States: AL, AK, AR, FL, ID, IN, IA, KS, KY, LA, MS, MO, MT, NE, ND, OH, OK, SC, SD, TN, TX, UT, WV & WY
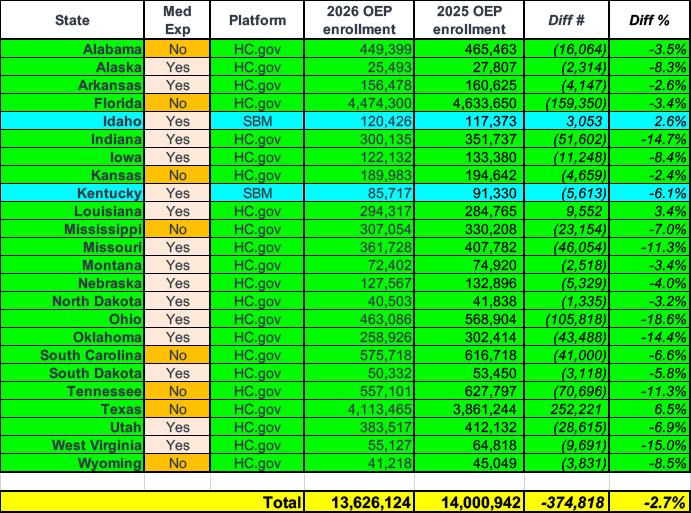
Collectively, these 24 states are down 2.7% vs. the same point a year earlier.
- Blue States: CA, CO, CT, DE, DC, HI, IL, ME, MD, MA, MN, NH, NJ, NM, NY, OR, RI, VT, VA, WA
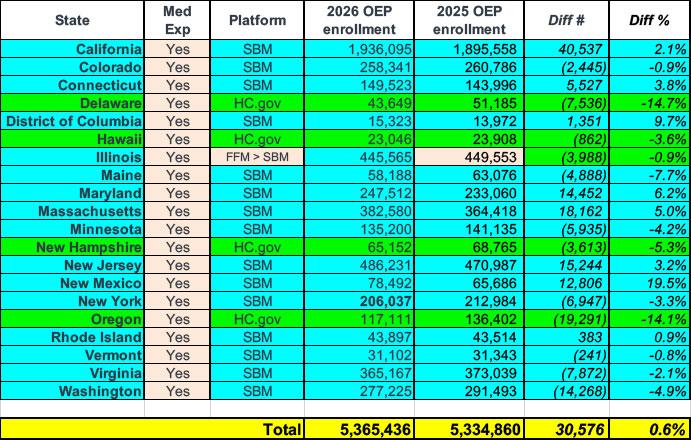
Enrollment in the 19 blues states (+DC) is actually up slightly so far, for reasons I'll get to in a moment.
- Finally, the Swing States: AZ, GA, MI, NV, NC, PA, WI

Whoa. Across all seven, they're down a whopping 11.5% so far this year.
Put another way, the enrollment loss rate is 4.2x higher in the swing states as the red states... and again, the blue states have actually gained enrollment overall.
It's important to note that these are all still semifinal numbers only; on the one hand, there's still anywhere from 12 - 35 days left in the Open Enrollment Period for every state (except Idaho) as of this data, so new enrollments will likely inch up a bit more by the various deadlines.
On the other hand, as I warned a few weeks back, the actual net attrition rate will likely be considerably higher than the ~834,000 who've dropped coverage to date. In fact, net enrollment actually dropped by over 14,000 people from 12/27 through 1/03, and dropped another 14,000+ from 1/03 - 1/10. That's a drop of over 29,000 people since the data in the report above in one state which had roughly 8% of national enrollment last year.
And again, California is one fo the states which was 2.1% ahead of last year as of this report--it's only up 0.4% y/y as of this week, and this is in one of the states which is backfilling 100% of the lost tax credits for a portion of their enrollees.
This brings me to the fact that blue state enrollment is currently running 0.6% higher than last year in spite of the expiring tax credits. The main reason for this is no doubt the state-based subsidies & programs to mitigate (or fully cancel out, in the case of New Mexico) the expiring subsidies, including California, Colorado, Connecticut, Maryland, Massachusetts, New Jersey, New Mexico, Vermont & Washington.
In any event, it will be interesting to see what 2026 OEP enrollment looks like when the dust settles, although that report may not be released until as late as early May, and even then, the effectuated enrollment data (which is the truer measure of how many people are actually enrolled in effectuated coverage) might not be published until sometime in July.
In the meantime, every state except Idaho still has until at least Thursday evening to enroll, so...
How to support my healthcare wonkery:
1. Donate via ActBlue or PayPal
2. Subscribe via Substack.
3. Subscribe via Patreon.
Advertisement