


The Republican Healthcare Disaster is already here: OVER TEN MILLION Americans have likely already lost healthcare coverage.
Wed, 09/02/2026 - 1:36pm
Yesterday I wrote about the standard monthly Medicaid/CHIP enrollment report published by the Centers for Medicare & Medicaid Services (CMS). I noted that as of April 2026, total combined Medicaid & CHIP enrollment had fallen by another 398,000 people, to around 73.9 million Americans.
I also noted that this figure is nearly 5.1 million lower than it was as of January 2025...the same month that Donald Trump returned to the White House and Republicans took over all three branches of the federal government.
However, this, combined with my obsession over the lack of any updates to the official "monthly" ACA exchange effectuated enrollment report since it was first published back in July, inspired me to take a closer look at just how many people have lost healthcare coverage total since the Trump 2.0 regime took power.
There's a lot of stories in the news these days about how many Medicaid enrollees are at risk of losing healthcare coverage after the first of the year, due primarily to the upcoming so-called "work requirements" (actually "reporting requirements") which are being imposed by last year's H.R.1, the so-called "One Big Beautiful Bill Act" or OBBBA.
However, as I warned over a year ago (shortly after the OBBBA was signed into law), over half the provisions of the Big Ugly Bill have already gone into effect...and the negative results are already devastating.
As I noted in my post yesterday, Medicaid/CHIP enrollment dropping isn't necessarily a terrible thing...depending on the reason why their enrollment is terminated.
- If it's because their income increased to the point that they are no longer eligible and they shifted over to a subsidized ACA exchange plan, that's a good thing (of course they may not see it that way since Medicaid provides more comprehensive coverage at almost no cost to the enrollees).
- If it's because they got a new job which includes healthcare benefits, that's a good thing!
- If it's because they joined the military and are now covered by the VA or Tricare, again, that's a good thing!
- If it's because they turned 65 and moved from Medicaid to Medicare, that's...fine!
- And of course in some cases they may have died. I mean, that's not a good thing, but it happens.
In order to figure out how many fewer people have comprehensive healthcare coverage now when Trump re-took office, there are five major enrollment numbers to look at: Employer-sponsored coverage, Medicare, Medicaid/CHIP, ACA coverage...and the total U.S. population (remember, population growth is a thing).
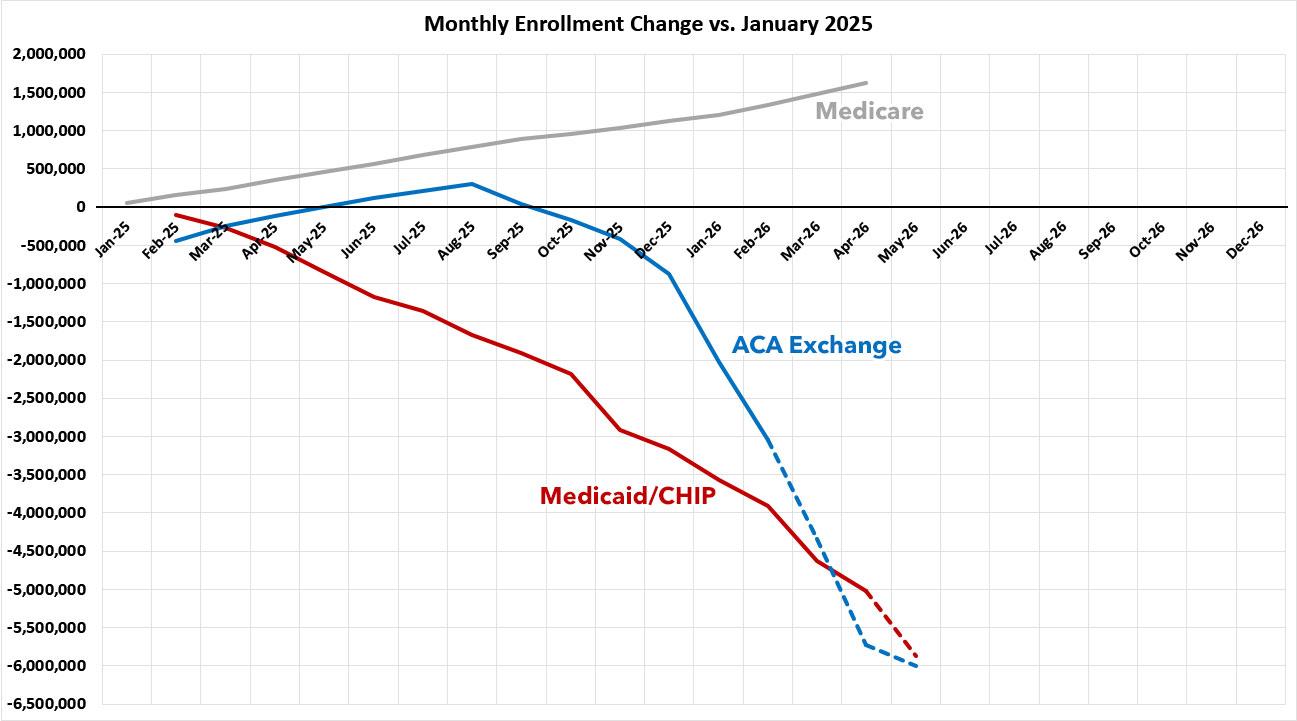
First up: Medicaid/CHIP (the Children's Health Insurance Program), which are grouped together for purposes of official enrollment reports. As I noted yesterday, enrollment in Medicaid/CHIP across all 50 states + the District of Columbia (I'm not looking at Puerto Rico or the other U.S. territories in this analysis) dropped from around 79.4 million people in January 2025 to less than 74.4 million as of April 2026...a drop of over 5 million people.
However, CMS has also published the preliminary Medicaid/CHIP enrollment report for May. I didn't use that report because the numbers often change a bit between the preliminary and final versions, but according to the preliminary data, Medicaid/CHIP enrollment had dropped by another 841,000 people from April to May 2026.
Assuming that doesn't change, total Medicaid/CHIP enrollment dropped by 5,867,291 from January 2025 to May 2026, or nearly 5.9 million people.
Next: Medicare. This is the easiest category, because the official CMS monthly report is also fully updated through May 2026. In this case, enrollment increases pretty much every month for an obvious reason: Over 90% those enrolled in Medicare became eligible because they turned 65, which means except for very rare exceptions, they're generally enrolled in it until they die. The other ~10% are people under 65 who have End-Stage Renal Failure (ESRF), Amyotropic Lateral Sclerosis (ALS, also known as Lou Gehrig's Disease), or who have been receiving Social Security Disability benefits for at least 24 months...many (most?) of whom are, again, enrolled in Medicare for the rest of their lives.
According to the latest report from CMS, as of May, just under 70.5 million Americans were enrolled in Medicare, or just under 1.6 million more than were enrolled as of January 2025. This reduces the number who have lost coverage to around 4.3 million.
Next: ACA individual market enrollment. Again, I was pleasantly surprised back in July when CMS revamped their ACA exchange effectuated enrollment database to bring it in line with the formats for Medicare and Medicaid/CHIP reports. The initial report included state-level effectuated enrollment data from all the way back in 2026 up through February 2026, which is very helpful!
As of February 2026, effectuated ACA exchange enrollment had dropped from 22.2 million Americans nationally to less than 19.2 million...a net drop of over 3.0 million people, pushing total coverage losses back up to 7.3 million people.
Unfortunately, as of this writing, CMS still hasn't deigned to bring their new ACA enrollment data up to May as they have with Medicare and Medicaid/CHIP, though I keep checking it daily to see if they've done so.
The good news is that I do have more recent effectuated enrollment data for 1/3 of the states, thanks to a combination of some of those states providing their own monthly (or at least occasional) enrollment reports and a handful of healthcare reporters who have gotten hard numbers directly from state insurance departments.
There's some important caveats to this, however:
- Nine states (CA, CO, MD, MA, MN, NH, NM, NY and PA) provide data every month, in some cases all the way up through August 2026
- Three states (IL, NJ & WA) have published a single effectuated enrollment figure, as of May, April and March respectively. For IL & NJ, I split the difference in half or in thirds to fill in the estimate for March.
- The other five states (AR, GA, NV, VT & VA) have single point-in-time enrollment data via snippets from local new stories, as of May, April, May, April and August respectively. Again, I split the differences by the number of empty months to fill in estimates for each.
- Finally, the methodology used by state-based ACA exchanges doesn't always match up with how CMS counts effectuated enrollment. For instance, CMS has California's February effectuated enrollment at 1,847,315, while Covered California's enrollment dashboard puts it a bit lower, at 1,813,200. On the other hand, CMS had Minnesota at just 104,788 effectuated enrollees as of February, while MNsure's slide deck has it at 129,756.
In order to address these discrepancies, for the states with their own monthly reports, I'm going by the monthly percentage change within those reports to estimate how much enrollment has likely changed from month to month overall. In other words, MNsure shows their enrollment dropping by 1.81% from February through March, so I'm assuming CMS's report will show a similar percentage drop from their lower February figure.
When I fill all of this out, it looks like so:

NEXT, I use the estimated (or actual) enrollment numbers for March, April and May for each of these 17 states to extrapolate what the monthly enrollment changes might look like nationally:

For instance, from February to March, I estimate that enrollment across these 17 states dropped by a further ~3.4%, which would translate to nearly 650,000 more people losing ACA enrollment nationally.
From March to April, I put it at a further ~3.7% drop (although only 16 states are included since I only have Washington data through March), or another ~690,000 people.
Finally, from April through May, I estimate that enrollment across the remaining 13 states only dropped by about 0.8%, or another ~140,000 people.
All told, if this is accurate nationally, it means that ACA enrollment dropped by another ~1.5 MILLION people from February through May 2026.
KEEP IN MIND, HOWEVER, that eight of the seventeen states that I'm basing this on, including the largest (California), also offer their own supplemental financial subsidies to enrollees!
I can't overstate how critically important this is, since some of these states are very generous with those subsidies, especially New Mexico!
- New Mexico is backfilling 100% of lost federal tax credits for 100% of enrollees!
- California is covering 100% of lost tax credits for all enrollees earning up to 150% FPL
- Maryland is covering 100% of lost tax credits fro all enrollees up to 200% FPL and 50% for those earning up to 400% FPL
- Colorado is providing up to $80/mo to the first member of households earning up to 400% FPL and up to $29/mo per additional household member
...etc, etc. In short, ACA enrollees in these states have been harmed far less (or not at all, in the case of NM!) than most of the other states.
In addition, states like Minnesota and New York have Basic Health Plan programs in place for enrollees earning between 138% - 200% FPL, which means their exchange enrollees have a very different financial skew than those in most states.
The larger point is that overall, I'd expect the drop in enrollment across the remaining 34 states (which collectively comprised 2/3 of total ACA enrollment as of February) to be considerably higher since almost none of them include any sort of mitigating factor like state subsidies, BHP programs and so forth.
To give you some idea of what I'm talking about, from January to February...
- Enrollment in these 17 states actually increased by 2.4%, from 6.35 million to 6.50 million
- Enrollment in the remaining 34 states dropped by 8.5%, from 13.84 million to 12.67 million
So, how much higher could the actual national drop since February be? That's difficult to say, but I'd put my 1.5 million estimate above as a lower bound limit, with perhaps double that, or ~3.0 million, as a realistic upper bound limit as of May 2026.
At this point, if you include Medicare, Medicaid, CHIP & ACA exchange enrollees, we're talking about a net drop ranging between ~8.8 million to ~10.3 million people.
BUT WAIT, THERE'S MORE!
This is where I'm bringing in population growth. For that I'm utilizing the U.S. Census Bureaus Monthly Population Estimates for the United States: April 1, 2020 to December 1, 2026, which I don't think has been messed with by the Trump Regime as of yet (I could be wrong, of course.
According to this report, the U.S. population as of May 2026 (again, only including the 50 states +DC) was around 342,467,403 people, versus 340,971,336 as of January 2025. That's net population growth of right around 1.5 million people.
If you add this population to the mix, you get a grand total of between 10.27 million and 11.75 million more Americans not enrolled in a public healthcare coverage program as of May 2026 than in were as of January 2025. It's important to note that this isn't quite the same thing as counting how many lost coverage, but not having healthcare sucks regardless of how you slice it.


- OK, but what about employer-based coverage? A lot of that population growth comes from newborn babies whose parents have coverage through the company they work for, right? And again, some number of those who have lost Medicaid, CHIP or ACA coverage have presumably transferred over to employer-based coverage as well, right?
Well...yes, except for one thing:
According to the Bureau of Labor Statistics, the unemployment rate as of January 2025 was 4.0%. The unemployment rate as of May 2026 was 4.3%.
Even if you go by the U-6 measurement, that was 7.5% in January 2025...and rose to 8.1% as of May 2026.
In other words, no matter how you slice it, fewer people were employed overall nationally in May 2026 than as of January 2025.
I'm not saying that there are fewer Americans with employer-based healthcare coverage than there were a year and a half ago, but I feel pretty confident that there aren't more people with ESI coverage either.
- What about the U.S. Military? This technically falls under "employer-based" coverage since your employer is, well, the U.S. Military, but according to the Defense Dept (no, I'm not gonna call it the War Dept), active duty military enrollment only increased by 26,000 people from May 2025 to May 2026.
- What about Federal Employees? Well, again, these fall under "employer-based" coverage as well...but it's a moot point anyway, since thanks to Elon Musk's DOGE Nazi Incel Brigade last year, the number of federal employees has dropped from ~3,010,000 in January 2025 to 2,685,000 as of May 2026...or 325,000 fewer.
- How about State and Local Government Employees? Nope...those dropped by around 76,000 nationally from July 2025 to July 2026 as well.
My guess is that several million people have been forced to turn to things like the so-called "short-term, limited duration" plans; association plans; farm bureau plans; "sharing ministries" and the like...which are, for the most part, pretty much junk.
And remember, all of this is BEFORE the Medicaid work reporting requirements kick into effect in most states starting in January.
Oh yeah, one more thing: Keep in mind that this only brings things up through May of this year. While it's theoretically possible that Medicaid & ACA enrollment will see a miraculous turnaround for the rest of 2026, it certainly doesn't seem like that's very likely to happen...
Anyway, I'm still hoping that CMS will finally update their ACA effectuated database with at least March data soon, which will eliminate a significant chunk of the uncertainty in my estimates above.
Advertisement


