

"But how many have PAID?" Revisited: Enrollment drop-off won't be fully known for months
Fri, 12/26/2025 - 1:58pm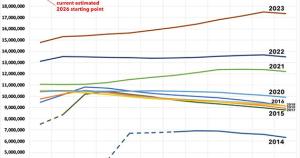
Long ago in a galaxy far, far away, during the first batcrap insane 2014 Open Enrollment Period, a common refrain from Republicans looking to attack the newly-ramping up healthcare law was to demand "BUT HOW MANY HAVE PAID???"
The gist of the attack on the ACA was that after the worst of the ugly technical problems experienced by HealthCare.Gov and many of the state-based exchange websites were resolved, there was indeed a rush of backed-up demand to enroll in healthcare coverage by millions of people, but that just because a lot of people signed up for insurance coverage via the exchanges, that didn't necessarily mean they were actually enrolled in that policy.
The reason for this, of course, is that you have to actually pay your first monthly premium in order to have your enrollment "effectuated" (i.e., put into effect).
The "BUT HOW MANY HAVE PAID???" mantra became something of a running joke for the first six months of 2014; I wrote about it numerous times myself, and it even became the headline of a column by Michael Hiltzik of the L.A. Times, and Paul Krugman featured some of my snark about it:
Many news reports are doing their best to somehow spin the final Obamacare surge as a negative story — yes, the website did go down a couple of times due to volume, which never, ever happens to commercial sites. The narrative of Obamacare-as-failure must not be challenged!
But the narrative is getting really hard to sustain. Charles Gaba:
There’s the usual yammering about “But how many have PAID???”, “But how many were ALREADY INSURED???”, “How many were YOUNG???” and “What METAL LEVEL did they get???” etc etc etc. All of these are reasonable questions for actuarials, accountants and so forth to ask, and the answers will indeed help shape our understanding of what the overall economic and health status of the population at large will be.
For the moment, however, none of that matters. This is an outstanding number any way you slice it.
The "But how many have PAID?" frenzy really reached a fever pitch near the end of April 2014, when the GOP-controlled House Energy & Commerce Committee released the results of a survey they had put out to insurance carriers demanding to know what percent of people who had enrolled in coverage during the Open Enrollment Period had actually paid their first premium.
They breathlessly published their conclusion, claiming that:
Data provided to the committee by every insurance provider in the health care law’s Federally Facilitated Marketplace (FFM) shows that, as of April 15, 2014, only 67 percent of individuals and families that had selected a health plan in the federally facilitated marketplace had paid their first month’s premium and therefore completed the enrollment process.
I quickly tore their "analysis" apart by pointing out some rather critical details about the survey, such as...
- Of the 8 million who had enrolled as of 4/15/14, only 5 million (63%) were actually required to have paid their first premium anyway;
- Their "only 67%" claim flew in the face of public statements by the insurance companies themselves, which put it at 80-95%;
- They curiously failed to include Idaho or New Mexico in their state breakout even though the ID & NM carriers had been included in the survey;
- They only included the 36 federal exchange states; the paid rates for the other 14 states +DC ranged from 68 - 100% as of 4/15 depending on the state;
- The survey itself had actually been sent to the carriers on March 13th, but the press release included no data about what dates the various carriers had returned them.
...and so on.
After the dust settled, it later turned out that the actual effectuation rate for 2014 turned out to be more like 80 - 85% (there was admittedly a lot of confusion and technical glitches to be worked out that first year), and by 2015 it was over 87%. Technical improvements, streamlined processes and a better-educated public resulted in this percentage increasing each year after that...it reached 90% by 2018, and has remained at ~90% or higher ever since.
I'm bringing all of this back up again today because I strongly suspect that the situation is about to reverse itself, with the Trump Administration already preparing to brag about impressive-sounding ACA enrollment numbers for 2026 in spite of the enhanced tax credits expiring less than 60 hours from now...even though the actual negative impact of the expiring tax credits (along with several other administrative policy changes made by CMS this year) likely won't be known for several months after Open Enrollment officially ends in January.
As I warned earlier this month, the following is likely about to play out:
1. Sometime on December 23rd (just before DC shuts down for the holiday break), Trump & CMS will crow about how he "managed Obamacare better than Obama & Biden!" even though it's "still terrible & needs to be replaced with a much better plan" which he'll be announcing "very soon, probably within two weeks!"
While this hasn't happened yet, a more subtle version of it did, with CMS Admin. Dr. Oz tweeting out that 15.6M people had enrolled via the federal exchange, while claiming that this was a "small drop" compared to "roughly" 16 million a year earlier. He then blamed this "small drop" entirely on "fraudulent and improper" enrollments.
As I noted last week, the "small" drop was actually more like 600,000 people via the federal exchange alone, and potentially up to 870,000 nationally if this was representative of the state-based exchanges.
2. Congressional Republicans will pounce on the high enrollment to mock Democrats for "needlessly scaremongering" everyone about people losing coverage etc etc, and how this "proves" that the enhanced tax credits "were never needed in the first place!"
3. Both Congressional Republicans & Trump will, of course, use the above as another excuse not to extend the enhanced tax credits.
4. Sometime between Christmas & New Year's Eve, millions of people who let themselves be auto-renewed will receive their January premium invoices...often for double, triple, quadruple or more than what they've been paying this year.
5. After they finish freaking the fuck out, some of them will use the extra time left in the Open Enrollment Period (most states will have until January 15th) to switch to a different plan starting in February. They'll still owe the January payment, mind you, and the plan they switch to will likely still cost somewhat more and/or have higher out of pocket costs than they do now. Oh, yeah...and the deductible & out of pocket cap will be reset for 11 months instead of 12, so anything they pay towards that in January won't be counted.
6. Others will be forced to drop coverage altogether. This is when the bulk of the "several million losing coverage" that the CBO projected will likely happen. Some may be able to cover the absurdly higher premiums for 3-4 months before having to drop coverage entirely, which will dilute the impact in the media.
7. Meanwhile, all of this will be playing out against the backdrop of the Continuing Resolution which Democrats agreed to last month expiring and the federal government facing another shutdown scenario at the end of January...once again, tied primarily to the enhanced tax credits being reinstated.
The point is that Trump & Congressional Republicans will get their victory lap & "Much Ado About Nothing" talking points out there before #4 - 7 above happen. Watch for it.
While I hope to be wrong about the above scenario playing out, it's important to prepare for it. To do so, I've created the following table and graph which break out the total number of effectuated ACA exchange enrollees nationally for each month of every year since January 2014.
The data for 2014 and 2015 are a bit spotty; I've filled in the missing months with my best estimates based on the total number of enrollments reported at the time.
For 2025, the data is only available through September for obvious reasons (the CMS reports includes exact data thru July; they have rounded-off estimates for August & September included in the monthly Medicaid/CHIP enrollment snapshot reports).
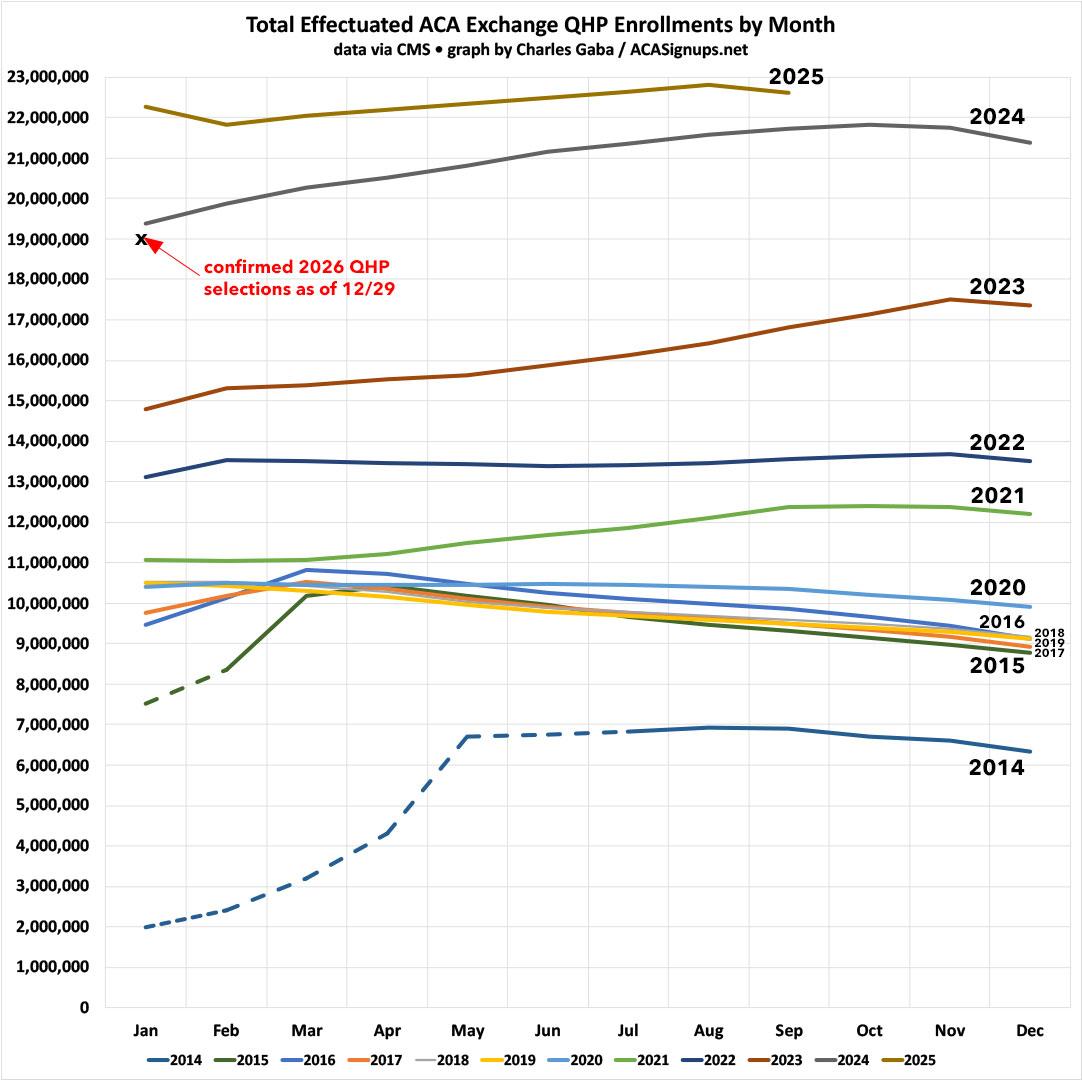
Put it all together and you get the following:
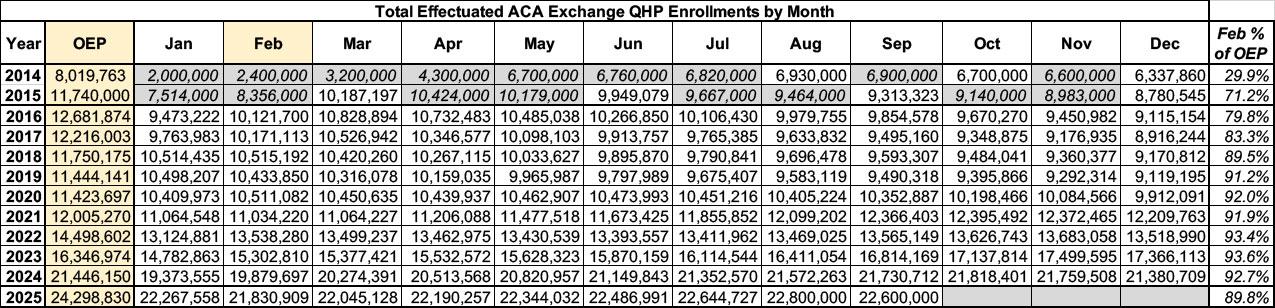
February has been the best month to use as an effecutated enrollment baseline because that's the first month in which coverage for all Open Enrollment Period enrollees is supposed to have started by the from 2016 onward.
In 2014, effectuated enrollment peaked in May (again, the official deadline was the end of March but was extended out to mid-April) before gradually dropping off towards the end of the year.
In 2015 - 2016 effectuated enrollment peaked in March before again dropping off throughout the year.
From 2017 - 2020 effectuated enrollment peaked in January...then dropped off gradually.
Since 2021, however, it's been a very different story: Effectuations either remained flat throughout the year or actually increased as the year went by. Much of this is thanks to the enhanced tax credits, of course; some of it is also due to the year-round Special Enrollment Period available for enrollees who earn less than 150% FPL...which is also being end-of-lifed two days from now.
So, what will this graph look like for 2026?
Well, my guess is that it will start out with perhaps a million fewer people enrolling to begin with. After that, I wouldn't be surprised if the slope for the rest of the year ends up looking more like 2017 - 2020 instead of 2021 - 2025.
IF that's what ends up happening, it would look something like the following:
- Total Open Enrollment QHP Selections: Perhaps ~23.3 million
- February 2026 Effectuation Total: Perhaps ~21 million
- December 2026 Effectuation Total: Perhaps ~17 million
- Full-year average effectuations: Perhaps ~18.5 million, vs. the ~22.5 million I expect 2025 to average...or ~4 million fewer people with coverage on average for the year. This would be in line with the Congressional Budget Office's projection of 4.2 million losing coverage due to the enhanced tax credits expiring.
Again, this isn't a projection on my part; I honestly don't know exactly what it will look like. The main point to keep in mind is that CMS is unlikely to actually publish that data until sometime in July 2026 if at all, so any crowing by the Trump Administration, Congressional Republicans or their allies about the tax credits expiring having a "minimal impact" etc. should be taken with a massive grain of salt until then.
Advertisement