

In which the WSJ Editorial Board does exactly what I predicted they'd do 3 weeks ago.
(Spoiler: They flat-out lie about ACA enrollment data)
...I'm bringing all of this back up again today because I strongly suspect that the situation is about to reverse itself, with the Trump Administration already preparing to brag about impressive-sounding ACA enrollment numbers for 2026 in spite of the enhanced tax credits expiring less than 60 hours from now...even though the actual negative impact of the expiring tax credits (along with several other administrative policy changes made by CMS this year) likely won't be known for several months after Open Enrollment officially ends in January.
...I honestly don't know exactly what it will look like. The main point to keep in mind is that CMS is unlikely to actually publish that data until sometime in July 2026 if at all, so any crowing by the Trump Administration, Congressional Republicans or their allies about the tax credits expiring having a "minimal impact" etc. should be taken with a massive grain of salt until then.
The Wall St. Journal editorial board, yesterday:
The ObamaCare Enrollment Apocalypse That Wasn’t
The decline as enhanced subsidies expired is far below CBO’s latest faulty forecast.
ObamaCare’s annual open enrollment ended Thursday, and what do you know? The media-fueled panic over the expiration of the pandemic-era enhanced subsidies turned out to be a false alarm.
The Centers for Medicare and Medicaid Services (CMS) reported this week that 22.8 million Americans have signed up for ObamaCare plans as of January 3. That’s down from 24.2 million last year. People could still sign up for plans on the federal exchange through Thursday, and some states have extended their open enrollment through the end of the month.
But even if there are few new sign-ups, enrollment is still running higher than it was in 2024—when the sweetened subsidies were available. The 1.4 million decline in sign-ups compared to 2025 enrollment is also less than was predicted. The left-leaning Urban Institute projected that ObamaCare’s subsidized enrollment would drop by 7.3 million.
The Congressional Budget Office’s ObamaCare baseline in 2024 assumed 18.9 million people would enroll in plans this year if the enhanced subsidies vanished. The budget gnomes have repeatedly underestimated ObamaCare enrollment and spending; they need to rework their models.
(sigh) OK, here we go.
First of all, let's take a look at the numbers in the WSJ piece.
"CMS reported that 22.8 million Americans have signed up...as of January 3."
22,774,847, to be precise. That's actually as of 1/03/26 across 30 states and as of 12/27/25 across the other 21 states.
"That's down from 24.2 million last year."
Actually, that's down from 24,319,713 last year (the WSJ is referring to the final 2025 Open Enrollment Period tally, not the semi-final number as of exactly a year earlier, but they're still off by ~120,000 plan selections).
"The 1.4 million decline...compared to 2025 enrollment is also less than predicted."
Actually, it's officially down 1,544,866 as of the dates cited in the CMS report vs. the final 2025 enrollment, over 144,000 higher than the WSJ claims.
However, all of the above is fairly minor compared to the most egregiously misleading claim in the WSJ piece, which appears in the next paragraph:
The Congressional Budget Office’s ObamaCare baseline in 2024 assumed 18.9 million people would enroll in plans this year if the enhanced subsidies vanished.
Let's take a look at that CBO "baseline," shall we?
On the surface it looks legit: As of July 2024, the CBO projected that ACA Marketplace Enrollment (both subsidized & unsubsidized combined) would indeed be around 18.9 million people in 2026.
HOWEVER, there's an extremely important footnote regarding what that 18.9 million figure refers to:
The estimates in this table underlie CBO’s June 2024 baseline projections of net federal subsidies for the premium tax credit and related spending. Estimates are for average monthly enrollment over the course of a year and include spouses and dependents covered under family policies.
Average monthly enrollment over the course of a year.
In other words, the CBO didn't say that they only expected 18.9 million people to select plans during the 2026 Open Enrollment Period.
What they said is that they expect the average monthly enrollment over the full 12-month period of 2026 to be around 18.9 million people.
That's an extremely important distinction, and it should be obvious why, as I pointed out in my post 3 weeks ago:
- First: Not everyone who selects (or is auto-renewed into) a plan pays their first monthly premium & is actually enrolled in that plan.
This was, ironically, the core of the GOP's "BUT HOW MANY HAVE PAID???" attacks on the ACA back in early 2014.
- Second: There's inevitable attrition over the course of the year as people who paid for the first month's premium drop their coverage partway through the year for a variety of reasons...which can very well include not being able to keep up with the premium payments.
This happened a lot for the first six years that the ACA exchanges were operating: From 2014 - 2020, effectuated enrollment wold peak early in the year and then gradually drop off over the course of the year, as the number of "off season" people enrolling via Special Enrollment Periods (SEPs) was far more than cancelled out by the number of existing enrollees who dropped their coverage part way through the year:
- In 2014, the official OEP tally was 8.02 million people...but effectuated enrollment peaked at just ~6.9 million in August and dropped off to ~6.3 million by the end of the year. 2014 average monthly enrollment was just ~5.47 million.
- In 2015, official OEP enrollment was 11.74 million, but effectuated enrollment peaked at around ~10.4 million, dropped to ~8.8 million and averaged 9.33 million.
- In 2016, official OEP enrollment was 12.68M; effectuated enrollment peaked at 10.8M & then dropped to 9.1M. Average: 10.0M.
...and so on.
The monthly average effectuated enrollment ranged from 68% to 91% of the official OEP total from 2014 - 2020.
Starting in 2021, however, with the enhanced tax credits being implemented along with some other Biden-era changes, the pattern changed dramatically.
- 2021: OEP: 12.0M; Peak: 12.4M; Final: 12.2M; Average: 11.73M (98% of OEP)
- 2022: OEP: 14.5M; Peak: 12.7M; Final: 12.5M; Average: 13.48M (93% of OEP)
- 2023: OEP: 16.3M; Peak: 17.5M; Final: 17.4M; Average: 16.15M (99% of OEP)
- 2024: OEP: 21.4M; Peak: 21.8M; Final: 21.4M; Average: 20.97M (98% of OEP)
- 2025: OEP: 24.3M; Peak: 22.8M; Sept: 22.6M; Average: 22.40M?* (92% of OEP?)
The table below lays all of this out more accurately. The effectuated enrollment numbers for 2014 and 2015 are a bit spotty as the Centers for Medicare & Medicaid Services were a bit scattershot about tracking that data the first couple of years (thus the rounded off greyed-out cells below), but the exact numbers for January 2016 - July 2025 are available via the (CMS) website.
*(For August & September 2025 the rounded-off numbers are included in the monthly Medicaid/CHIP enrollment reports, and I'm assuming that October - December 2025 tracked the last 3 months of 2024)
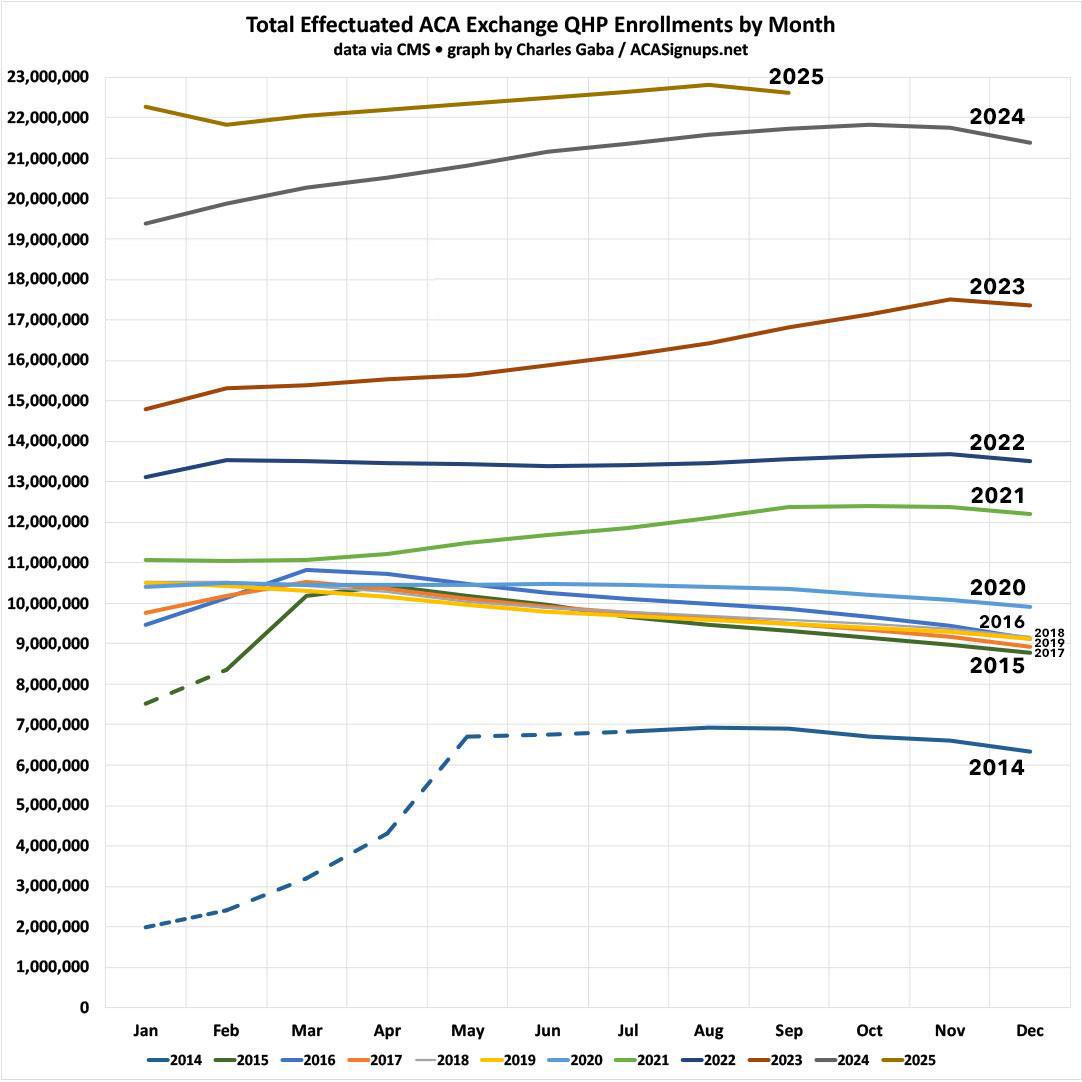
Here's what it looks like altogether:
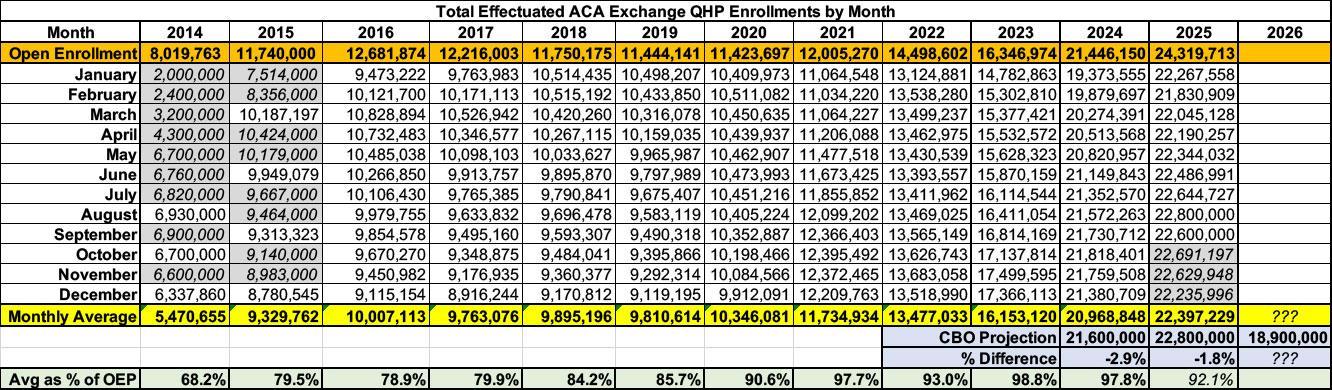
As you can see, the CBO projection of average monthly effectuated enrollment was actually slightly too high in both 2024 and 2025 (actual average monthly enrollment was 2.9% and 1.8% lower than the CBO projected in both years).
I have no idea what the actual monthly average will be for 2026 (and neither does the Wall St. Journal), but here's what it will look like assuming an additional 200K, 400K or 600K enrollees are added over the final weeks of the Open Enrollment Period (which ended on Thursday in most states and will end by January 31st in the rest) and assuming the monthly effectuation pattern ends up mirroring any of the earlier pre-enhanced tax credit years:
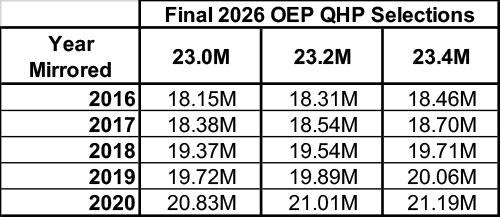
In short, if it ends up mirroring 2016 or 2017, actual enrollment will end up being lower than the CBO projected, while if it ends up mirroring 2018 - 2020 it will likely be higher than the CBO projected, but potentially not by much.
OK, but what about the other number mocked by the Wall St. Journal?
The left-leaning Urban Institute projected that ObamaCare’s subsidized enrollment would drop by 7.3 million.
Well, here's the Urban Institute study they're talking about:
We project that 7.3 million fewer people will receive subsidized Marketplace coverage in 2026 if PTCs revert to their standard levels than if enhanced PTCs are extended. Eight states, Georgia, Louisiana, Mississippi, Oregon, South Carolina, Tennessee, Texas, and West Virginia, would see their subsidized Marketplace enrollment fall by more than half.
Without enhanced PTCs, we project that 4.8 million more people will be uninsured in 2026 relative to a policy that extends enhanced PTCs, an increase in the uninsured population of 21 percent.
Subsidized enrollees is the key word here. That doesn't mean that total ACA exchange enrollment will drop by 7.3 million. For comparison, in 2025 there were 1.64 million people who selected exchange plans during Open Enrollment who earned more than 400% FPL, all of whom have lost subsidy eligibility (assuming they re-enrolled at all).
Another ~550,000 earned less than 100% FPL; the vast majority of those were documented immigrants living in the U.S. for less than 5 years, who also just lost subsidy eligibility as of January 1st. Combined, that's at least 2.2 million right off the bat (admittedly, some of those > 400% weren't eligible last year either).
The point is that for the Urban Institute study it's the 4.8 million becoming uninsured figure which is more relevant to this week's CMS report...and even then, saying "4.8M more will be uninsured due to the subsidy expiration" isn't quite the same thing as saying "4.8M fewer will be enrolled in exchange plans due to the subsidy expiration" since the former includes interactions with other factors. They actually cite one of these in the study:
...people with employer-sponsored insurance offers who qualify for Marketplace subsidies because their offers are deemed unaffordable (costing more than 9.96 percent of household income for a single person) and who choose Marketplace coverage under enhanced PTCs will make the switch back to employer-sponsored insurance or go uninsured under standard PTCs.
Having said that, Urban's projection may very well be overstating the negative enrollment impact...but again: Effectuated enrollment data for the first few months of 2026 likely won't be known until at least July, so the Wall St. Journal can just take a damned seat until then.
In fact, the actual enrollment drop won't really be known until after April 1st, because the ACA requires insurance carriers to provide a 90-day grace period for non-payment of premiums...which means anyone who fails to make their January payment may not officially drop off the "effectuated enrollee" list until April...and if the July reports don't include April effectuations, it won't show up then either.
P.S. Oh yeah, one more thing: There's another reason why 2026 enrollment may not drop off quite as much as the CBO projected: A bunch of blue states, including California, Colorado, Connecticut, Maryland, Massachusetts, New Jersey, New Mexico, Vermont & Washington are partially or fully backfilling some or ALL of the lost federal tax credits for some or ALL of their enrollees!
In New Mexico, for example, total 2026 OEP plan selections are a whopping 17% higher than last year, pretty much entirely thanks to them fully backfilling 100% of all lost tax credits for 100% of all enrollees.
That's not a factor which the CBO could have possibly taken into account in July 2024, and it's not one which the WSJ, Congressional Republicans or the Trump Regime gets to take credit for.
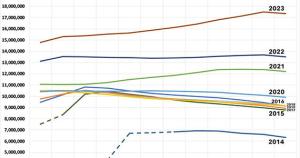
As an aside, here's what every year up through 2025 looks like visually:
Advertisement