South Dakota has around ~54,000 residents enrolled in ACA exchange plans, 94% of whom are currently subsidized. I estimate they also have another ~3,000 unsubsidized off-exchange enrollees.
(Unfortunately, Avera hasn't provided a justification summary and has almost completely redacted their actuarial memo, making it impossible for me to know what their current enrollment is; see below)
With the pending dire threat to several of these programs (primarily Medicaid & the ACA) from the House Republican Budget Proposal which recently passed, I'm going a step further and am generating pie charts which visualize just how much of every Congressional District's total population is at risk of losing healthcare coverage.
USE THE DROP-DOWN MENU ABOVE TO FIND YOUR STATE & DISTRICT.
Pretty straightforward in the Mount Rushmore state. Three carriers on the individual market; around 56.4K enrollees total. The weighted average rate change across all three is +2.3% if approved as is.
Note that I've added a new feature to my rate change spreadsheet this year: I've started including the on exchange effectuated enrollmentas well as the subsidized on exchange enrollment as of February for every state. This will allow me to calculate the percent of the total individual market which is receiving ACA subsidies...at least in states where I'm able to figure out what total off-exchange enrollment is (typically only around half of them).
In South Dakota, for instance:
95.7% of on exchange enrollees are subsidized (49,250 / 51,416)
87.2% of the total market is subsidized (49,250 / 56,457)
On exchange enrollment makes up around 91% of the total individual market
For the small group market, there are five carriers this year; Medica Insurance Co. appears to be pulling out of the state. The weighted requested average rate change is a 2.8% increase.
Pretty straightforward in the Mount Rushmore state. Three carriers on the individual market; around 48,000 enrollees total; requested rate changes ranging from a slight drop to a 5.9% increase. The weighted average across all three is +2.5%. No one new seems to be entering the market and none of the current ones are pulling out.
For the small group market, there are six carriers (again, no one new, no one dropping). The requested rate increases for these range from 2.5% to 10.3%, with a weighted average increase of 5.2% statewide.
Update 11/08/23:No changes to any of the preliminary filings on either market.
SIOUX FALLS, S.D. (Dakota News Now) - Although Medicaid expansion in the state of South Dakota doesn’t take effect for another month, the window to apply opened on Thursday. A kickoff event was held for advocates and patients to review the benefits for those who qualify.
“Today has been long overdue. No one should have to choose between bankrupting their family and getting the health coverage they need,” said Dr. Dan Johnson from the American Cancer Society.
After the hard work of gathering petition signatures and talking to voters, Medicaid expansion advocates are celebrating enrollment opening for South Dakota residents.
...Over 50,000 people will be eligible for Medicaid, as voters approved Constitutional Amendment D last November. Erik Nelson, an advocate with AARP, has had positive conversations with the state handling the logistics of enrollment.
...Even if applicants don’t have their application completed by the July 1 effective date, a plan is in place.
...over the past few years, the voters of some of those states have decided to take it upon themselves to force their legislators/governors to expand Medicaid anyway, via statewide ballot initiative campaigns:
In South Dakota, there are only 2 carriers offering individual market coverage next year. Avera has around 21,800 enrollees; Sanford has roughly 23,900. The weighted average rate increases requested are around 11.4%.
For the small group market, I don't even have a decent total market size to base an estimate off of, so I have to go with the unweighted average of 4.3%.
UPDATE 11/01/22: Well, it looks like the individual market filings were approved as is. I'm guessing the small group carrier filings were as well, though I don't know that for sure.
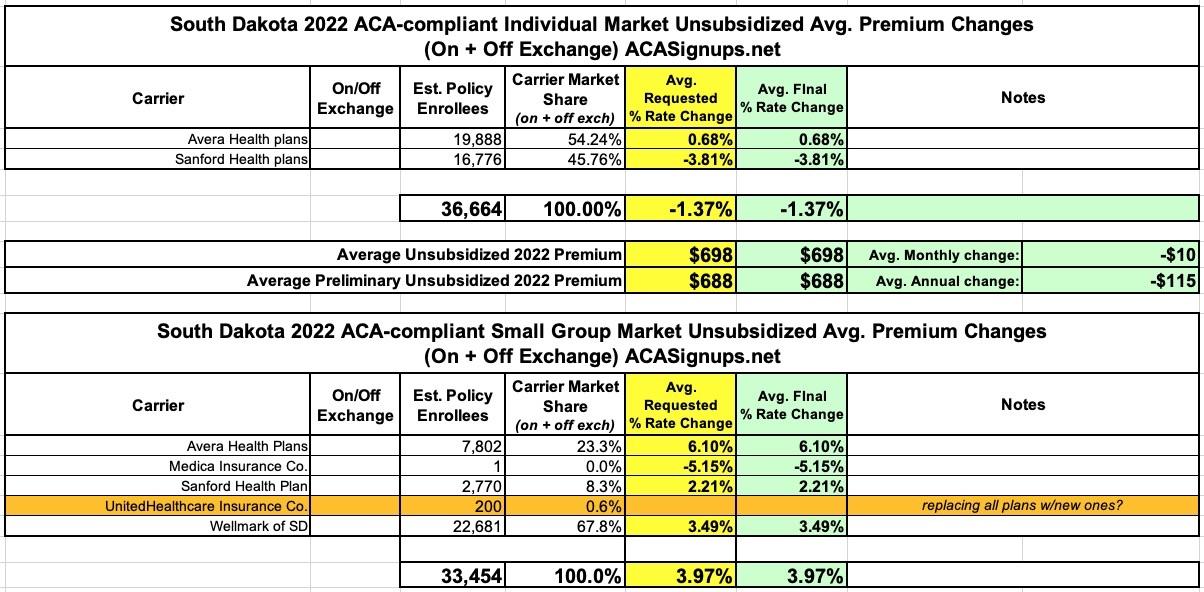
South Dakota's 2022 rate filings are pretty straightforward. There's still just two carriers offering policies on the individual market (Avera and Sanford), while it looks like UnitedHealthcare may be dropping out of the states small group market (they have a rate filing in the SERFF database, but it doesn't show up on the federal Rate Review database, and even the SERFF filing doesn't lis any specific rate increase or decrease).
Assuming all are approved as is, residents are looking at a 1.4% rate drop on the individual market and a 4.0% increase for small group plans.
UPDATE 10/26/21: Sure enough, it looks like all rate requests have been signed off on as is.
I've once again relaunched my project from last fall to track Medicaid enrollment (both standard and expansion alike) on a monthly basis for every state dating back to the ACA being signed into law.
South Dakota is one of 12 states which still hasn't expanded Medicaid eligibility under the ACA (13 if you include Missouri, whose voters expanded the program last year...but which the state legislature refuses to fund).